Visualize a mixed-workload
Setup
I used my viz_workload tool to capture data while running a multi-node workload that featured mixed phases:
- write 8GB to disk
- high cpu load on 4 threads
- flush the disk cache to force disk read in next step
- read 8GB from disk
Here's the actual script:
#!/bin/bash
# Simulate a workload with:
# - disk write 8GB to disk and sync
# - high cpu load on 4 threads
# - flush the disk cache to force disk read in next step
# - disk read 8GB from disk

TMP_FN="$HOME/.tmp.viz"

cleanup () {
  rm -f "$TMP_FN"
  exit "$1"
}

trap 'cleanup 1' SIGTERM SIGINT # Cleanup tmp file if killed early

echo "Writing to disk"
dd if=/dev/random of="$TMP_FN" bs=1024k count=8192
sync
sleep 2

echo "Loading CPU on 4 threads"
timeout 30 taskset -c 0 bash -c "while true; do true; done;" &
timeout 30 taskset -c 1 bash -c "while true; do true; done;" &
timeout 30 taskset -c 2 bash -c "while true; do true; done;" &
timeout 30 taskset -c 3 bash -c "while true; do true; done;" &
wait
sleep 2

echo "Clearing disk cache prior to disk read"
echo 1 | sudo tee /proc/sys/vm/drop_caches

echo "Reading from disk"
dd if="$TMP_FN" of=/dev/null
Hardware
I have 2 ~$200 servers running Ubuntu that I use for various things, like:
| server name | Architecture | link |
|---|---|---|
lynx |
Intel | Amazon |
moose |
AMD | Mini's forum (discontinued model) |
Results
System snapshots
One of the cool things about this tool is how much data it captures about each node prior to running the workload.
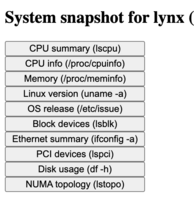
Check out the interactive pages for:
Workload data
You can clearly see the different phases (disk write, high CPU, disk read) of the workload in the graphs.
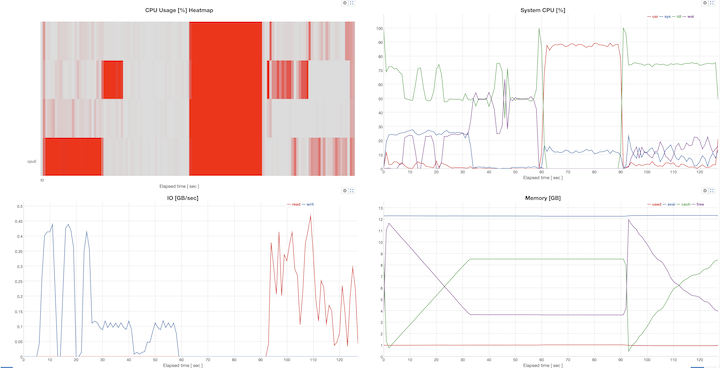
For moose:
- disk read and sync takes about 60sec
- high CPU load for ~30sec
- disk read for the remaining ~25 sec
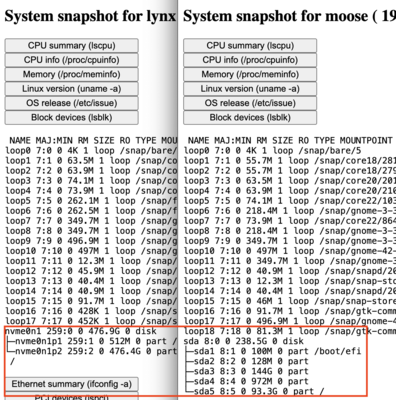
The lynx
performance is significantly faster iduring the IO portions, thanks to NVME on lynx vs
standard HDD on moose. You can find this info from the system summary:
 .
.